Our graph for our ecosystem.
These measurements were taking from shyla smith. She is in our group. Sometime i ask her for the co2, oxygen levels, and temperature.when she not here, i have to take the measurements from ecosystem on a computer. after the 3 weeks it was time to the last measurements before we open it.
Temperature
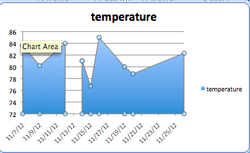
Here is our temperature. On 11/15/12, has lowest temperature. on 11/17/12 has the highest temperature 85, because both lamps are on. The graph shows lows and high temperature.
Oxygen level
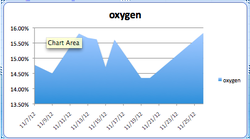
here is our oxygen level. On 11/19/2012-11/21/2012 has the lowest oxygen level. on 11/11/12 is the highest oxygen level.
Carbon dioxide
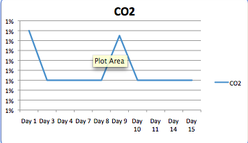
The carbon dioxide is at .9%. When it was sealed. I don't know why.
